ICoRD’21
ICoRD’21 Interactive Schedule
Designed and developed an interactive version of the ICoRD '21 (International Conference for Research in Design) schedule. This conference is held every 2 years and was hosted in IDC, IIT Bombay in 2021.


ICoRD’21
ICoRD’21 Interactive Schedule
Designed and developed an interactive version of the ICoRD '21 (International Conference for Research in Design) schedule. This conference is held every 2 years and was hosted in IDC, IIT Bombay in 2021.
01
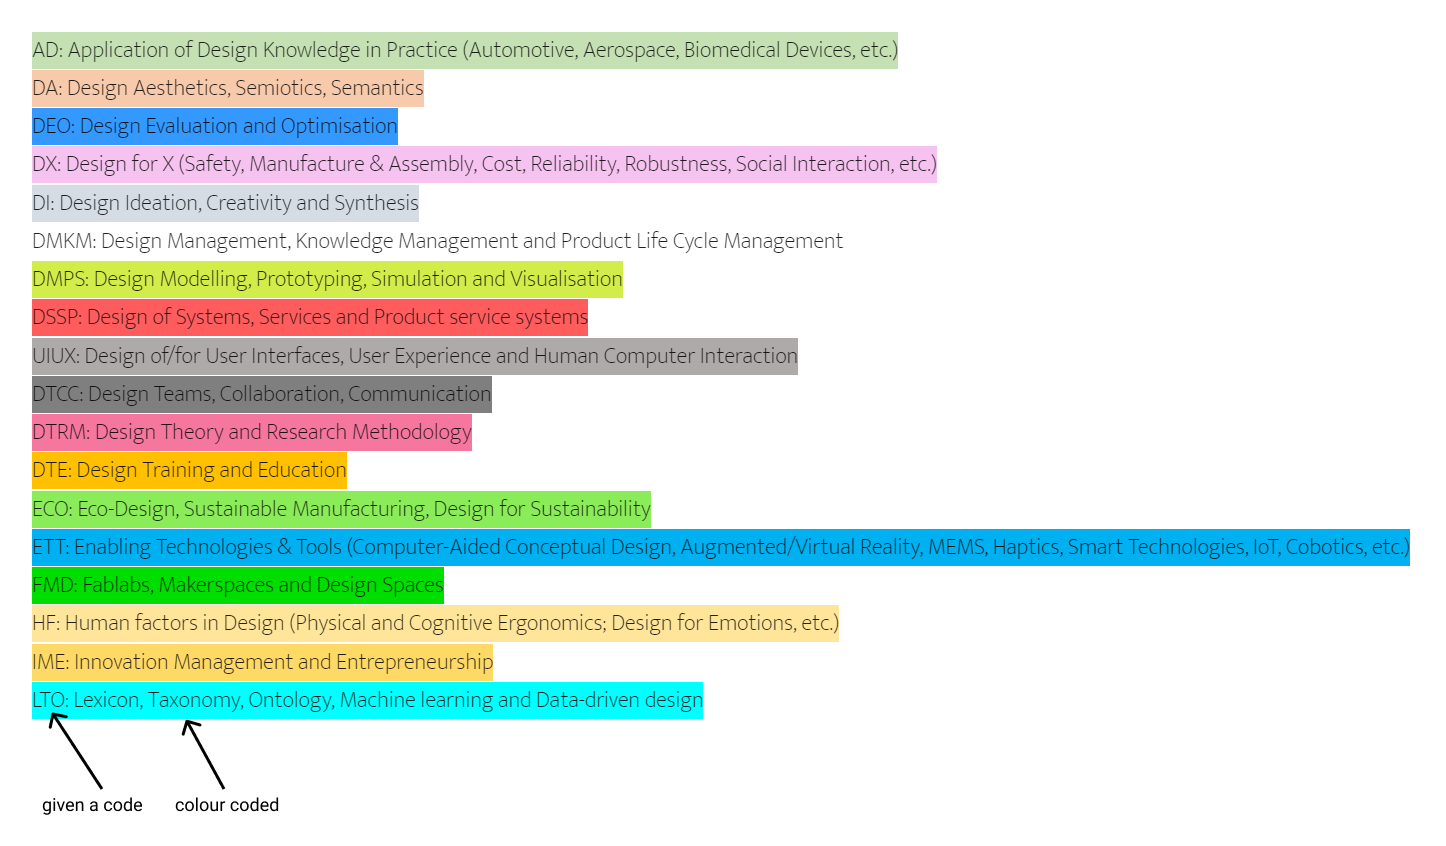
Index section
Over here we can see that the types of papers are divided into categories which are color coded. They are also given code to identify them easily in the schedule.02
Schedule section
In this section we can see the day number is on the left and details of each parallel session is listed with their timings, paper ids and Chair names.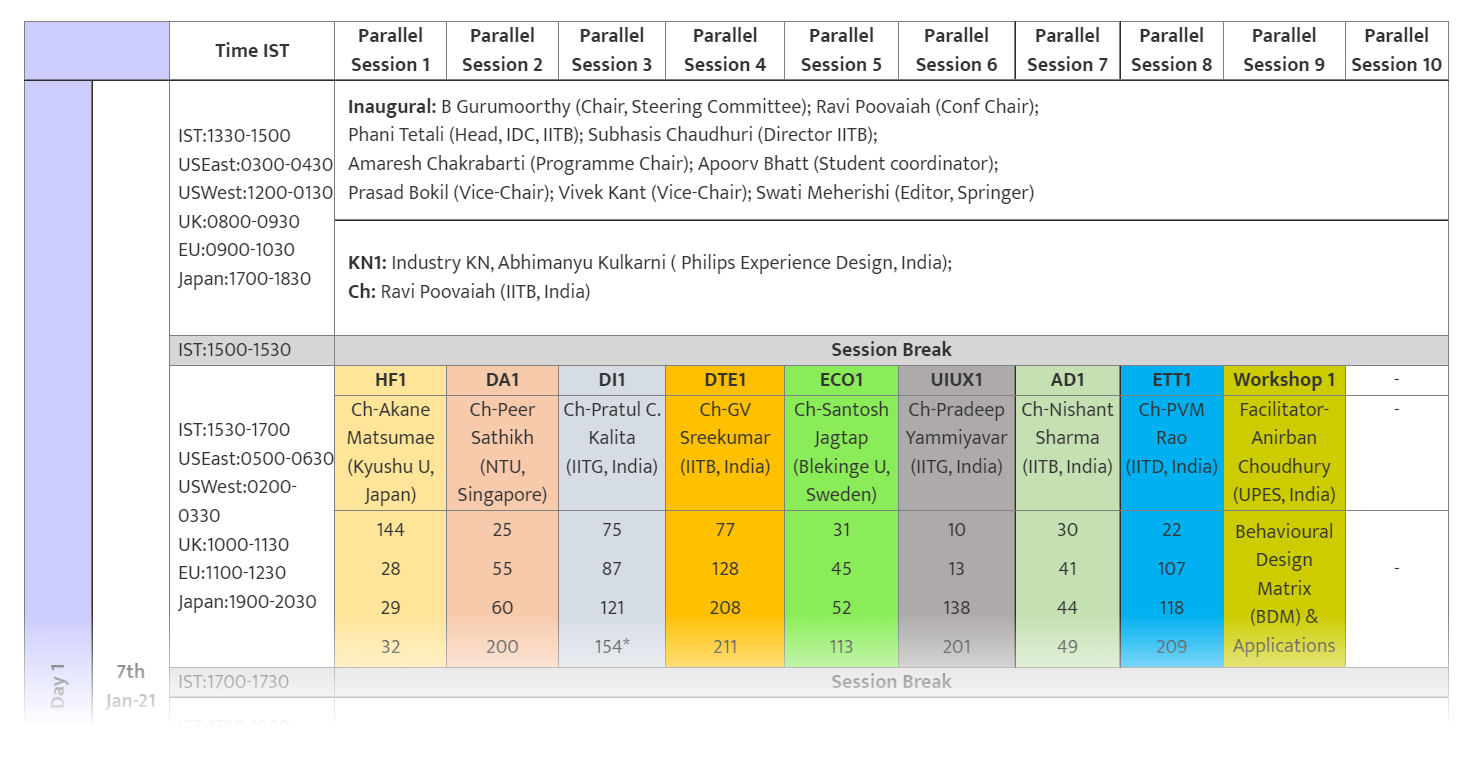
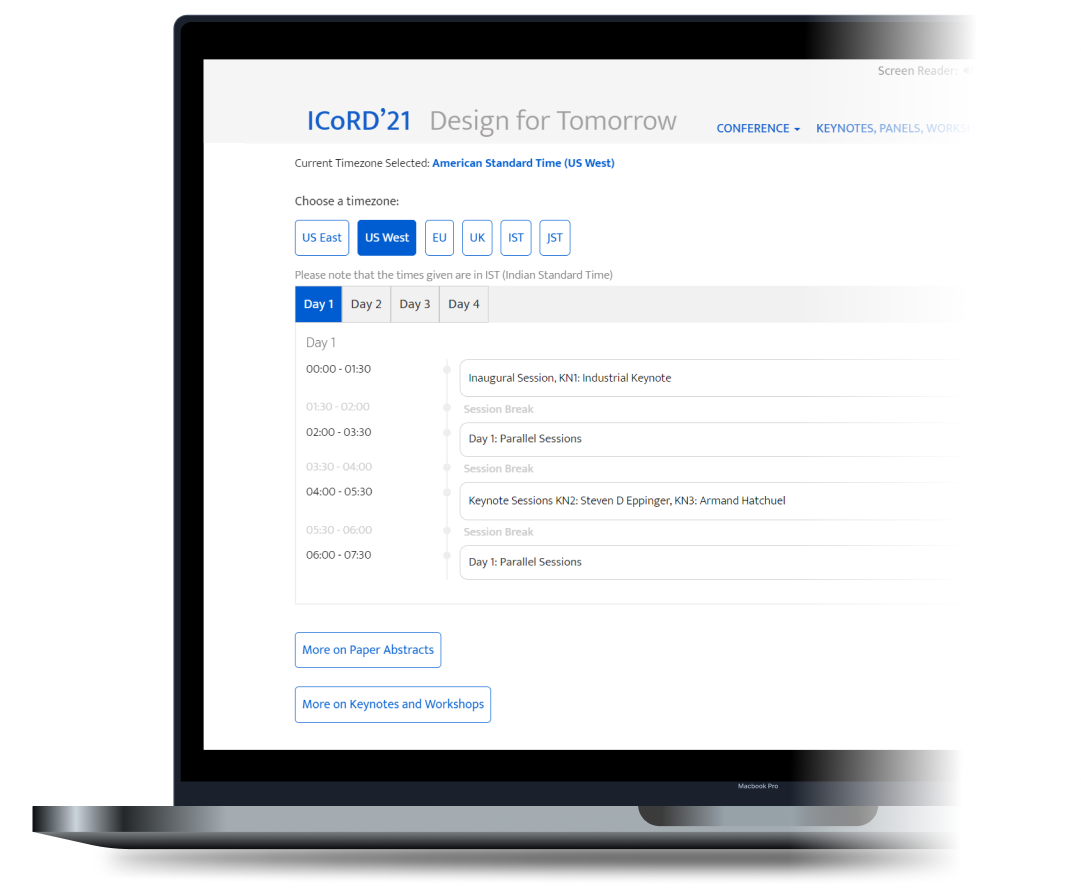
01
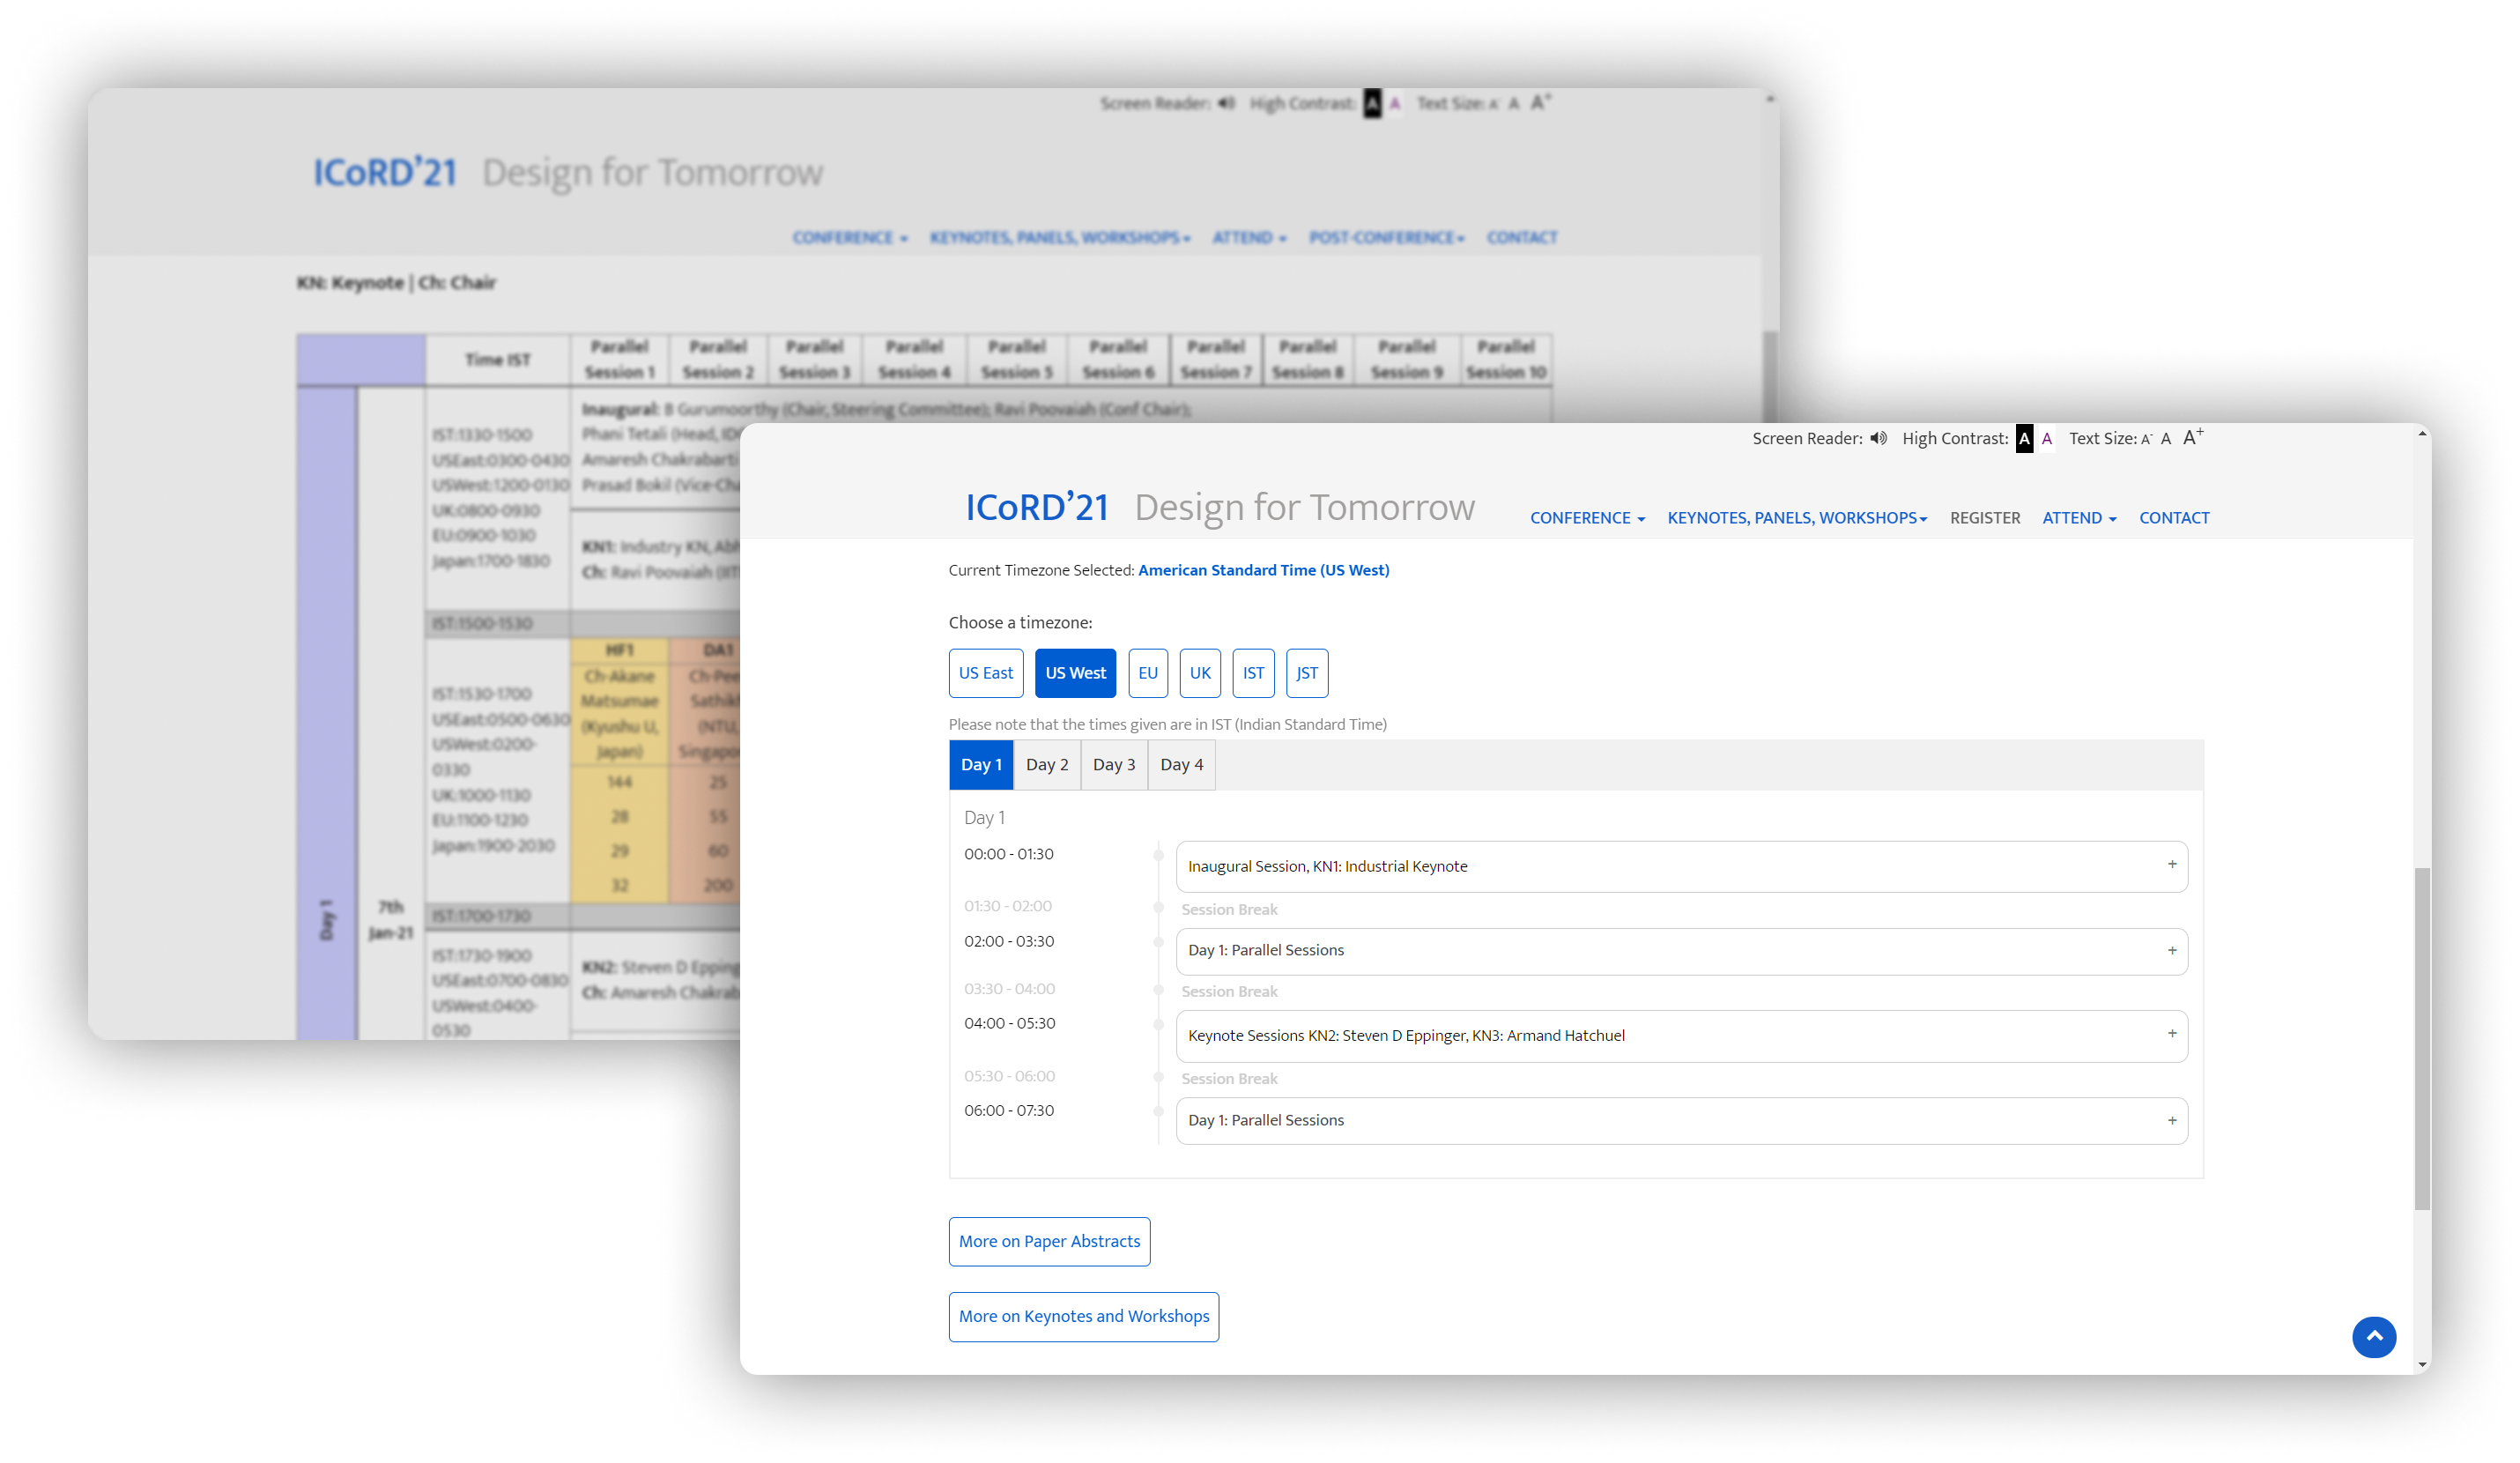
Home
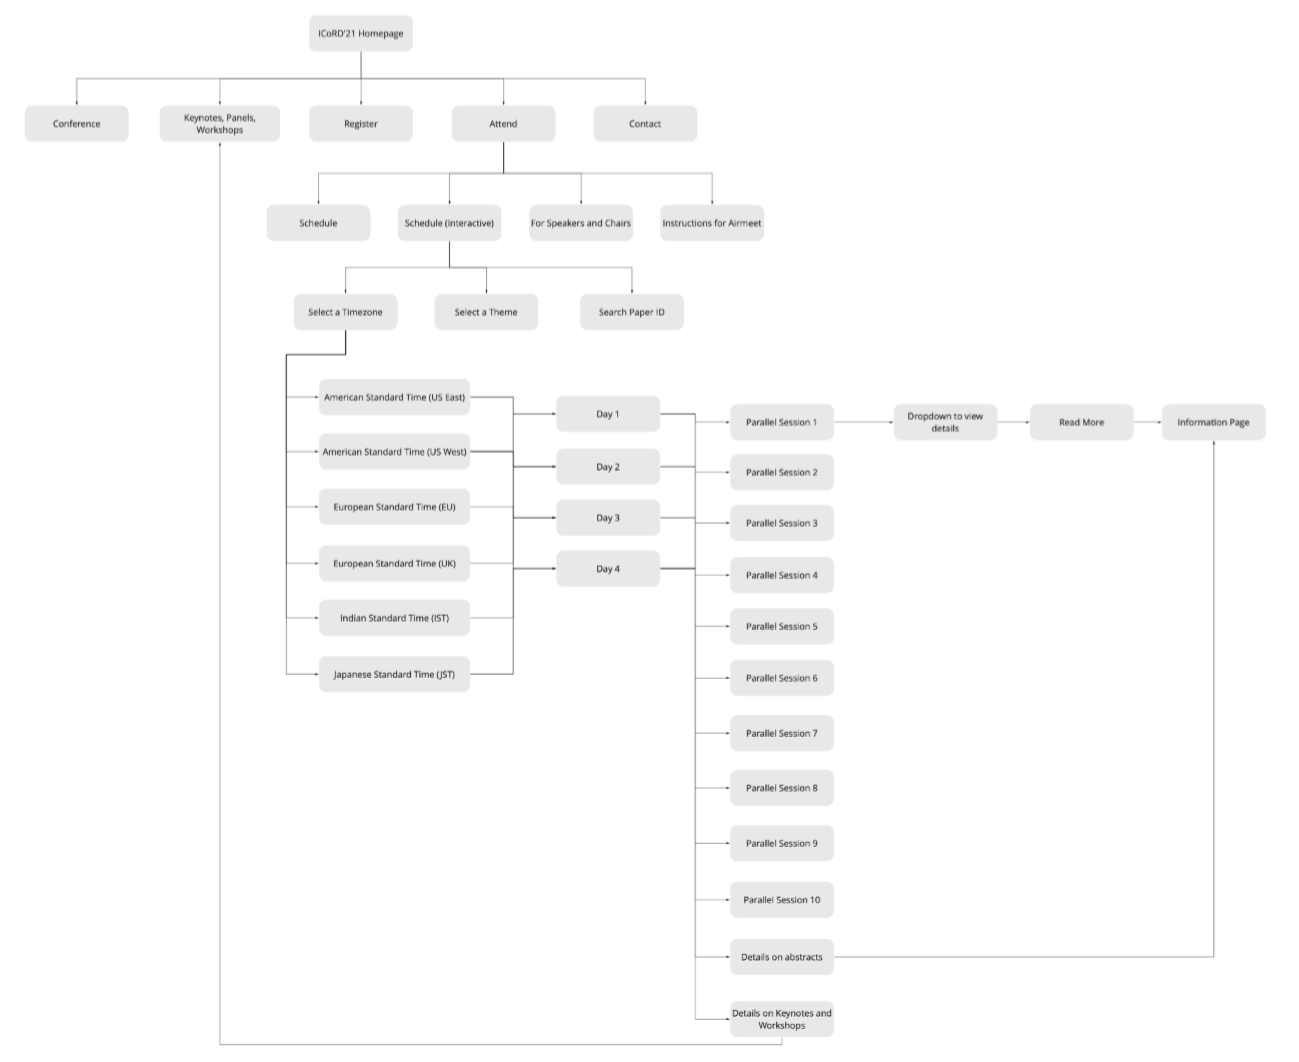
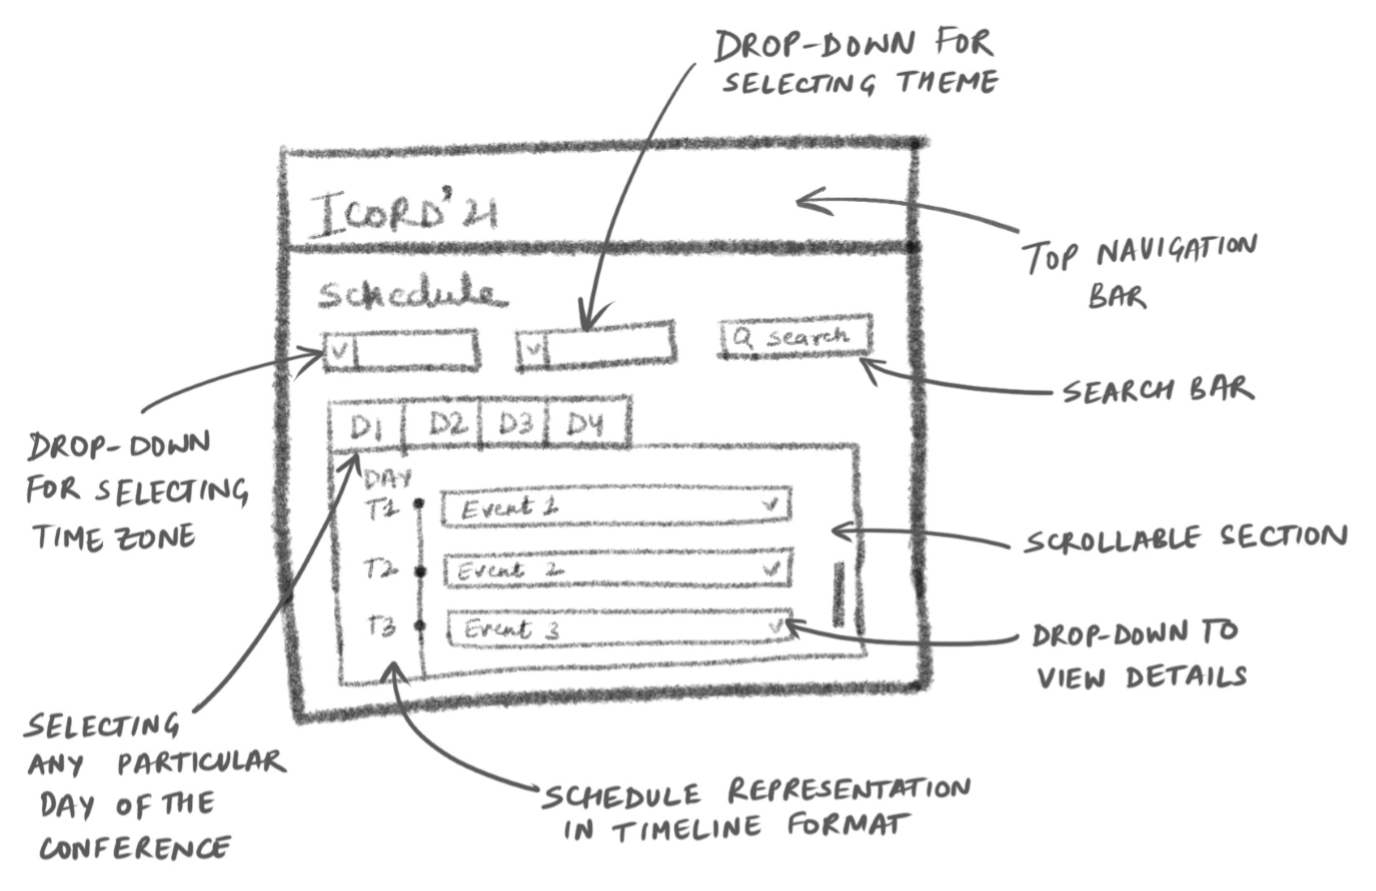
This is the home page of the interactive schedule. We can choose our timezones and choose the particular day we wish to attend upon choice of interest. The breaks are clealy segregated by reduction of opacity. In the bottom we also have the links to view all the paper abstracts and the information about keynote speakers and workshops.02
Expanded view
Over here we can see that if we click on a particular heading, in this case, Day 1: Parallel Sessions, the section expands to reveal the parallel sessions. Each parallel session is color coded and displays all the papers being presented and their respective authors.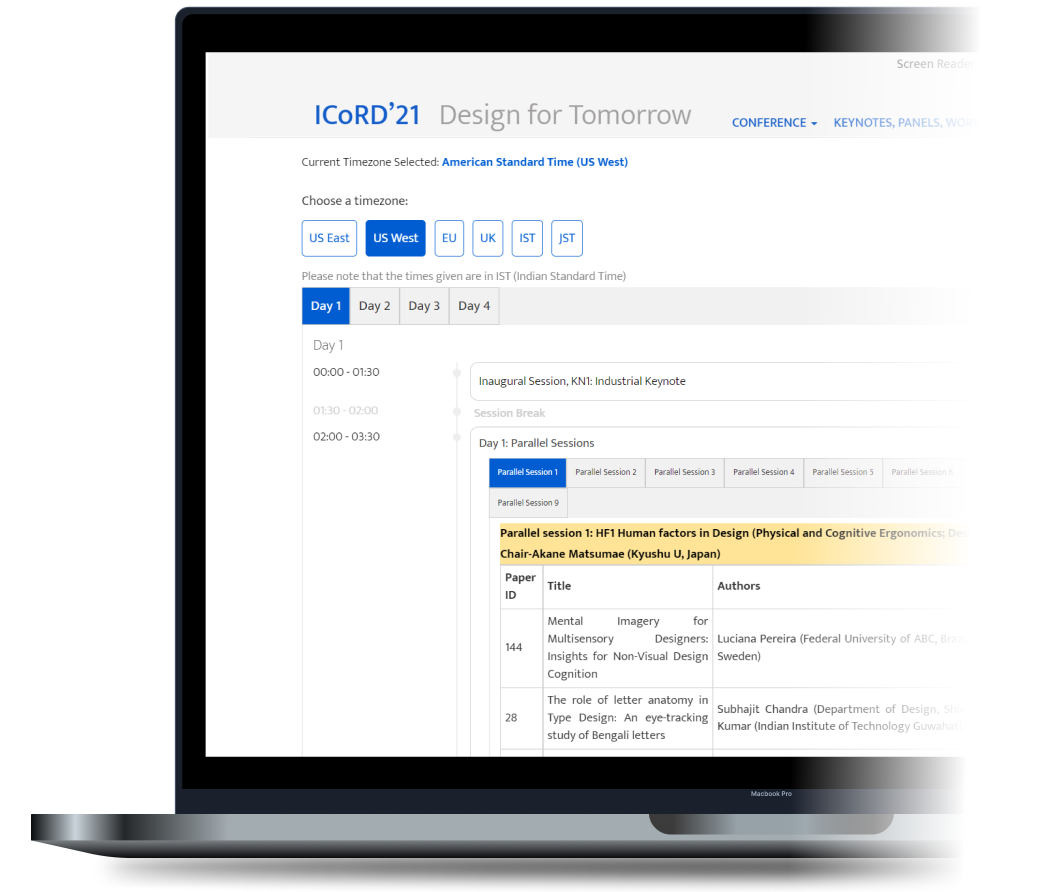
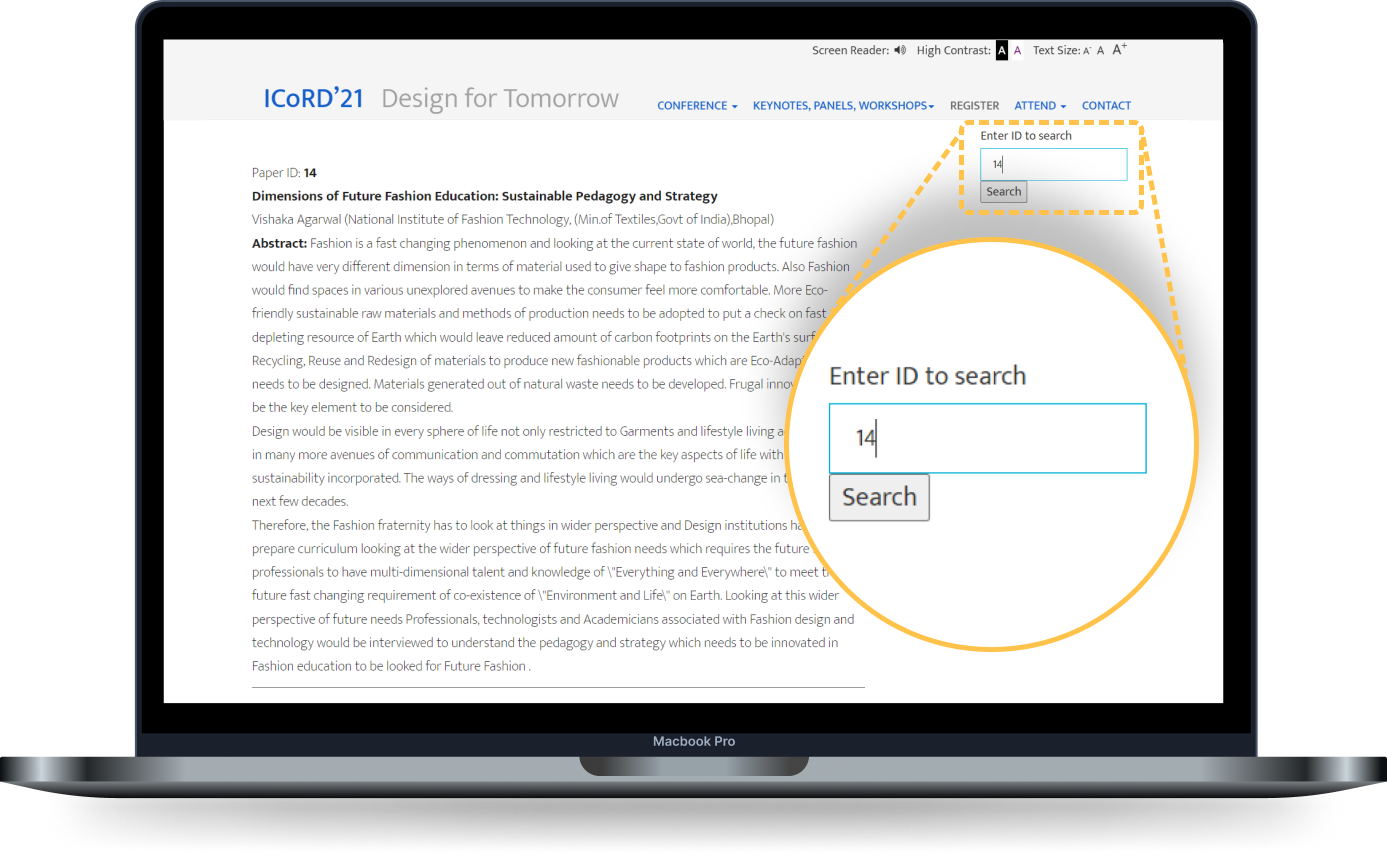
03
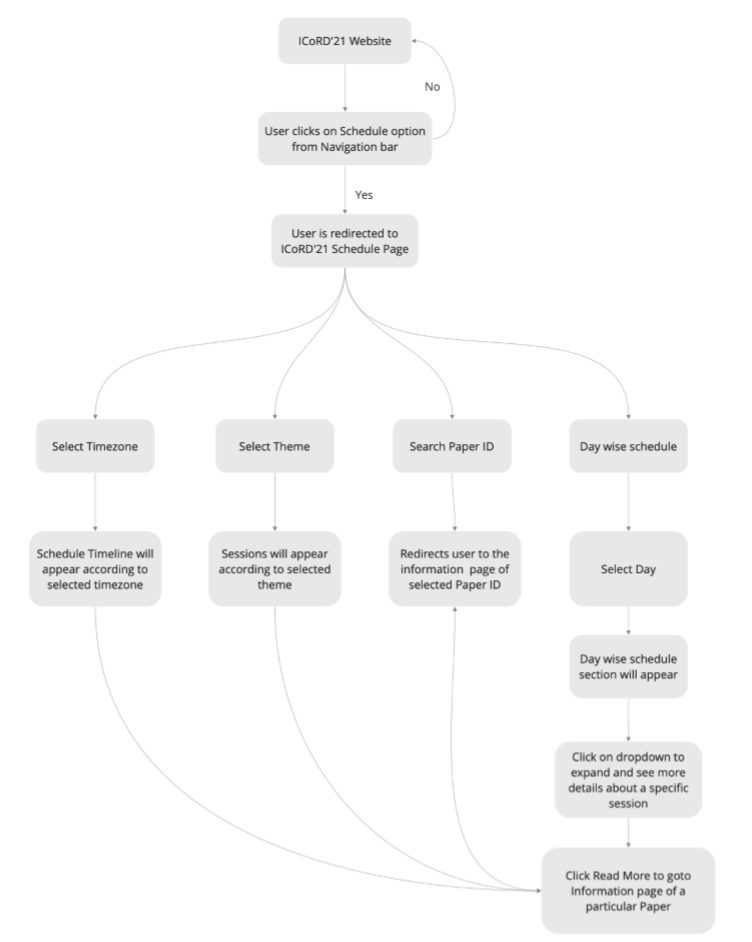
Paper abstracts section
In here, we developed an entire page where people can read the abstracts of the papers being presented. They could be seached by inputting the id provided in the previous table.